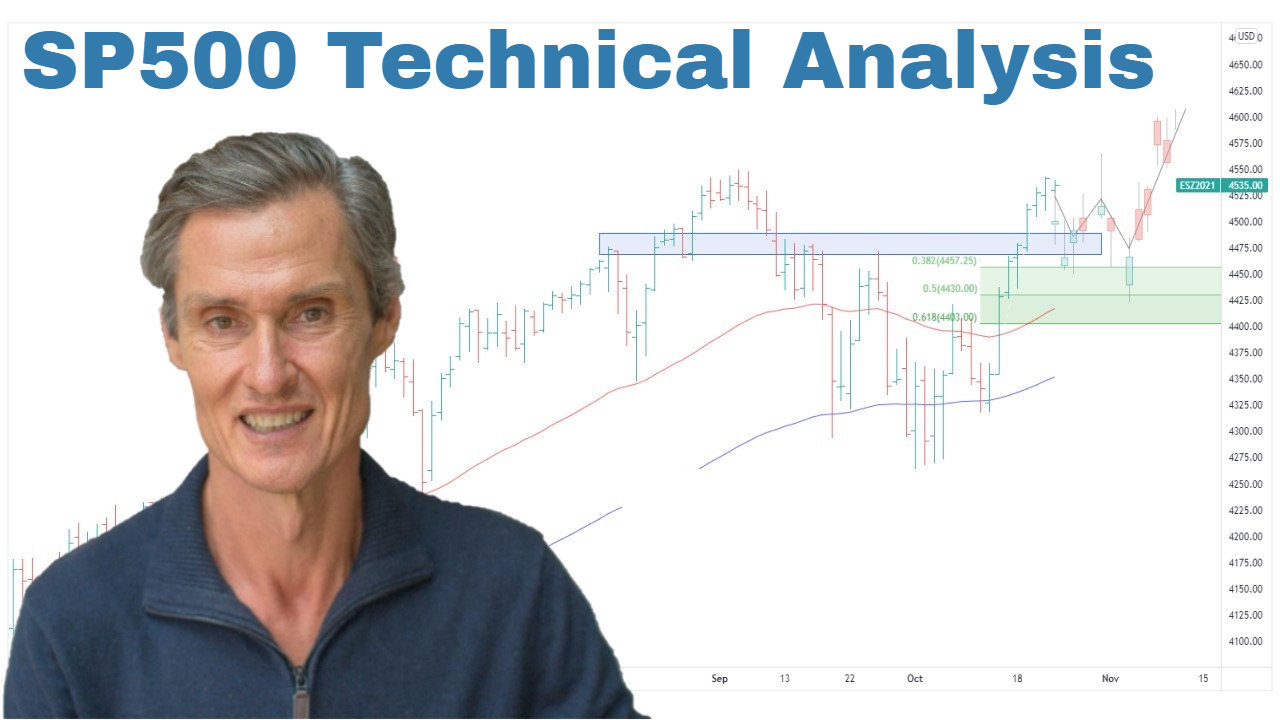
S&P 500 Technical Analysis: Post-Election Rally and Market Dynamics | Episode 266

By Jason McIntosh | 22 November 2024
The S&P 500 has been at the center of attention following the recent U.S. presidential election, reaching new all-time highs. This surge prompts a critical question: is this rally based on hype, or does it signal the start of a sustained upward phase in the market? Let’s explore the technical analysis of the S&P 500 to understand the current market dynamics and potential scenarios for investors.
Understanding the Post-Election Rally
The post-election rally in the S&P 500 has been significant, driven by investor optimism about a business-friendly administration and favorable economic policies. However, the key test for this rally’s sustainability is whether there is substantial buying interest during pullbacks.
Technical Analysis Insight: Fibonacci Retracements
Fibonacci retracements are used to identify potential support and resistance levels by measuring the extent of a previous move. They provide percentage-based ranges that help traders anticipate where a pullback might find support. Learn more about Fibonacci retracements.
Current Market Conditions
Last week, the S&P 500 stabilized after initial gains, with prices beginning to rally again. The recent pullback found support within a key Fibonacci retracement zone, indicating potential strength in the market.
Key Technical Indicators: Moving Averages
Moving averages are essential tools in technical analysis, offering insights into trends and potential support/resistance levels. The S&P 500 remains above its rising 50-day and 100-day moving averages, suggesting a bullish trend. Discover more about moving averages.
Equal Weight Perspective
The S&P 500 Equal Weight Index has been tracking higher alongside the main index, indicating broad market participation rather than reliance on a few large-cap stocks. This broad participation is a hallmark of a healthy bullish market.
Technical Term: Equal Weight Index
An equal weight index assigns equal importance to each stock, providing a more balanced view of market performance compared to traditional indexes weighted by market capitalization.
Potential Scenarios for the S&P 500
- Sideways Consolidation: The market may trade sideways near the upper end of the Fibonacci retracement zone while moving averages catch up.
- Continued Uptrend: Strong buying interest could lead to further gains.
Conclusion: Optimism with Caution
While it’s tempting for many people to predict market tops, staying with strong trends often yields better results in technical analysis. However, robust risk management strategies are crucial to protect capital when trends eventually reverse.
For investors and traders, maintaining exposure to equities seems prudent given the current bullish setup.
****
Looking for the best ASX stocks to buy now?
Motion Trader‘s algorithms scan more than 2,000 ASX stocks daily in search of medium term investment trends. We then tell our members precisely when to buy shares. And most importantly, we tell them when to sell.
Try a no obligation FREE 14-day trial of Motion Trader, and see what an algorithmic trading approach could do for you.
****
Video Links
For reference to the topics discussed:
07:10 SP500’s pullback suggests THIS happens next
10:25 Key index tells us a lot about the US market’s health
11:37 Whatever you do, don’t do this!

Jason McIntosh | Founder, Motion Trader
Jason’s professional trading career began over 3 decades ago. He’s a founder of two stock advisory firms, a listed funds management business, and has helped thousands of investors navigate the stock market. Click here to read Jason’s incredible story of, at age 20, sitting alongside some of the world’s greatest traders (and the life changing experience that came with that).

