S&P 500 Technical Analysis: Navigating Post-Election Rally and Pullback | Episode 264

By Jason McIntosh | 15 November 2024
The recent U.S. election has sparked significant movement in the stock market, particularly in the S&P 500. Let’s dive into a detailed technical analysis of the current market situation and explore potential scenarios for investors and traders.
Post-Election Rally: A New All-Time High
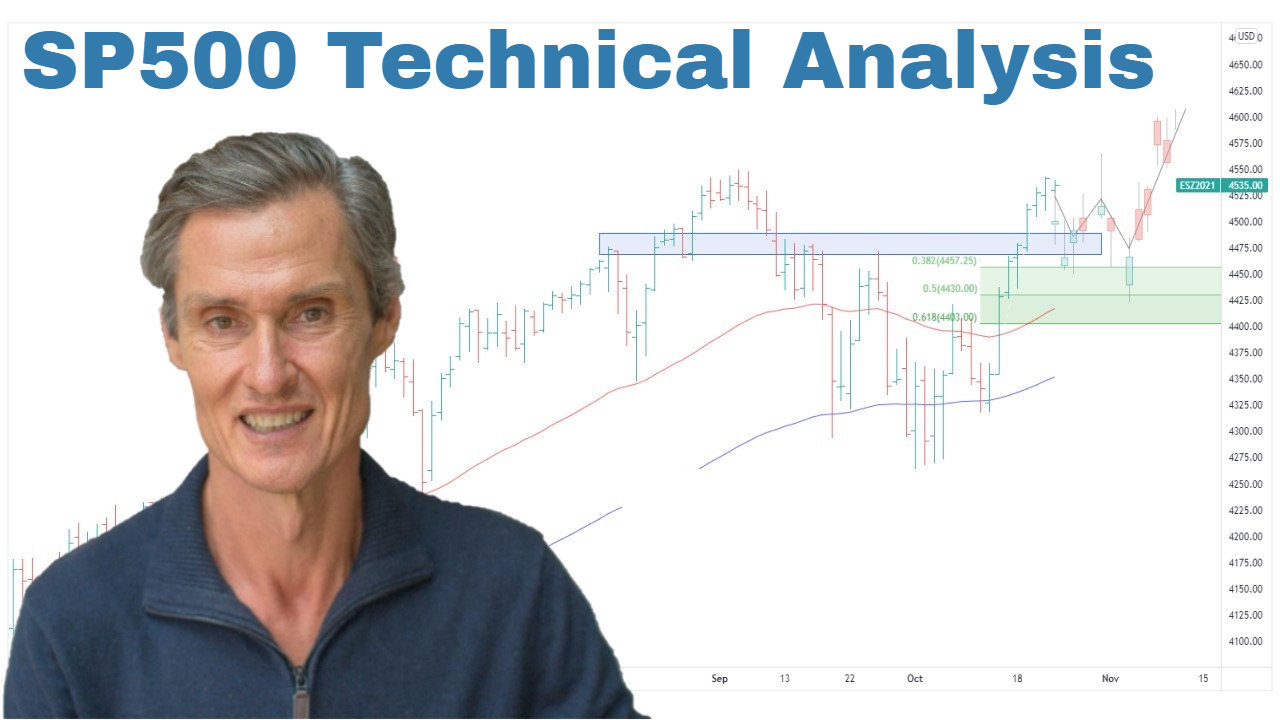
The S&P 500 experienced a strong rally following the election, pushing off the 50-day moving average to reach a new all-time high. This surge demonstrates the market’s initial positive reaction to the election results.
Technical Analysis Tip: Moving Averages
Moving averages are crucial indicators in technical analysis, helping traders identify trends and potential support/resistance levels. Learn more about moving averages in technical analysis.
The Current Pullback: A Test of Market Strength
As with any significant rally, a pullback has begun. This retracement is a critical juncture for the market, as it will reveal the underlying strength of the recent upward move.
Key Factors to Watch:
- Buying interest on the dip
- Extent of the pullback
- Support levels holding
Fibonacci Retracements: A Guide for Potential Support
Applying Fibonacci retracement levels to the recent rally provides a framework for potential support zones. The pullback is likely to find support within the Fibonacci retracement zone, which often coincides with other technical levels.
Technical Analysis Concept: Fibonacci Retracements
Fibonacci retracements are horizontal lines that indicate where support and resistance are likely to occur. They are based on key Fibonacci ratios and can be valuable tools in technical analysis.
Learn more about Fibonacci retracements.
Price Gap Support: A Confluence of Factors
Interestingly, the Fibonacci retracement zone aligns with the top of the post-election price gap. This confluence of technical factors suggests a potentially strong support area for the S&P 500.
Technical Analysis Pattern: Price Gaps
Price gaps are areas on a chart where the price of a stock (or other financial instrument) moves sharply up or down, with little or no trading in between. Gaps can act as support or resistance levels in future price action.
Potential Scenarios for the S&P 500
- Sideways Consolidation: The market may trade sideways near the upper end of the Fibonacci retracement zone while moving averages catch up.
- Shallow Pullback: If buying interest remains strong, we could see a modest pullback before resuming the uptrend.
- Deeper Retracement: A lack of buying interest could lead to a more significant pullback, potentially testing lower support levels.
The Bullish Case: Staying with the Trend
From a trend perspective, the S&P 500 remains in a bullish position with rising 50-day and 100-day moving averages and price action above these averages. This technical setup suggests giving the prevailing upward trend the benefit of the doubt.
Trading tip: S&P 500 trend following strategies
Trend following is a popular trading strategy that aims to capitalize on long-term market movements. Explore trend following strategies for the S&P 500.
Conclusion: Optimism with Risk Management
While it’s tempting to try and pick market tops, the real money in technical analysis is often made by staying with strong trends for as long as possible. However, it’s crucial to have robust risk management strategies in place to protect capital when trends eventually reverse.
For traders and investors, the current market situation calls for cautious optimism. Stay alert to buying interest on dips and keep an eye on key technical levels for signs of continued strength or potential weakness in the S&P 500.
****
Looking for the best ASX stocks to buy now?
Motion Trader‘s algorithms scan more than 2,000 ASX stocks daily in search of medium term investment trends. We then tell our members precisely when to buy shares. And most importantly, we tell them when to sell.
Try a no obligation FREE 14-day trial of Motion Trader, and see what an algorithmic trading approach could do for you.
****
Video Links
For reference to the topics discussed:
11:20 Is the SP500 rally all hype? (This could tell us)
14:15 Here’s the bottom line for US stocks
15:00 Big money is made by doing THIS

Jason McIntosh | Founder, Motion Trader
Jason’s professional trading career began over 3 decades ago. He’s a founder of two stock advisory firms, a listed funds management business, and has helped thousands of investors navigate the stock market. Click here to read Jason’s incredible story of, at age 20, sitting alongside some of the world’s greatest traders (and the life changing experience that came with that).

