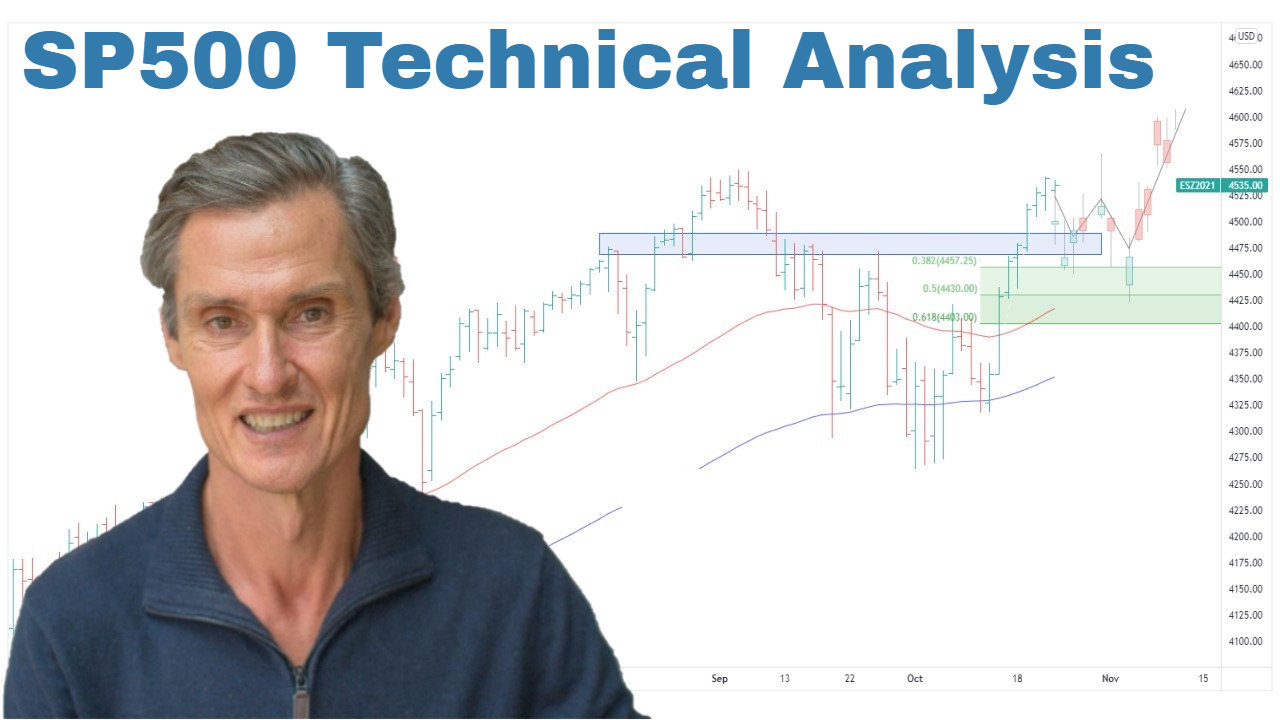
S&P 500: Crosscurrents and the Case for Caution | Episode 277

By Jason McIntosh | 10 January 2025
The S&P 500 is presenting a fascinating mix of technical signals as we move further into January 2025. While the market capitalisation-weighted index appears poised for a potential breakout, underlying data and equal-weight measures suggest a more cautious outlook.
Let’s break down the technical setup, explore key indicators, and discuss strategies for navigating this complex environment.
S&P 500: Coiling for a Breakout?
The S&P 500 has been consolidating in a tight range over the past three weeks, forming what appears to be a bullish coiling pattern. Prices have retreated towards the rising 50-day and 100-day moving averages, and this sideways movement could be setting the stage for a rally.
Key Observations:
- Bullish Setup: Rising moving averages and price compression into these levels are hallmarks of a bullish continuation pattern. Historically, these setups often resolve to the upside.
- No Guarantees: While the chart structure suggests higher levels, even reliable patterns can fail, and caution remains essential.
Equal-Weight S&P 500: A Different Picture
When examining the S&P 500 on an equal-weighted basis, the bullish outlook fades. Unlike the market-cap-weighted index, the equal-weight version is consolidating below its 50-day and 100-day moving averages, which are beginning to roll over.
Key Observations:
- Rolling Moving Averages: Prices consolidating below rolling moving averages create a window of vulnerability.
- Market Concentration: The disparity between the two indices highlights the dominance of a few large-cap tech stocks, masking broader market weakness.
Key Indicator: Stocks Above 100-Day Moving Average
One concerning signal is the percentage of S&P 500 stocks trading above their 100-day moving average. As of now, only 38% of stocks meet this criterion, a stark contrast to the bullish coiling pattern seen in the index itself.
Key Observations:
- Underlying Weakness: This percentage broke down in early December and remains in a steep decline.
- Crosscurrents at Play: While the S&P 500 trends upward, the majority of its components are trading below key technical levels, a bearish signal.
Possible Scenarios
- Bullish Breakout: The S&P 500 could break higher, supported by large-cap strength, while the percentage of stocks above their 100-day moving average rebounds.
- Failed Breakout: A new high might trigger a “buy the rumor, sell the fact” scenario, leading to a larger market consolidation.
Strategies for Navigating This Market
In light of these conflicting signals, a balanced and cautious approach is essential. Here’s how to manage these conditions:
- Stay on the Trend: The primary trend remains up. Avoid trying to predict tops and instead follow the market until it confirms a breakdown.
- Monitor Indicators: Keep a close eye on the percentage of stocks above their 100-day moving average and the equal-weight index for signs of further deterioration.
- Reduce Risk: Scale back exposure by not rushing to replace stocks hitting exit levels and consider reducing ETF holdings if necessary.
- Use Trailing Stops: Protect gains by employing trailing stops on profitable trades.
- Prioritize Strong Setups: Focus on stocks with the clearest bullish setups and avoid speculative positions.
Final Thoughts
The S&P 500’s bullish technical setup is encouraging, but the underlying weakness in the broader market warrants caution. By staying disciplined, using risk management strategies, and maintaining a balanced approach, investors can navigate these crosscurrents with confidence.
At Motion Trader, we provide systematic, rules-based strategies to help investors make informed decisions in all market conditions. Whether markets are trending higher or showing signs of vulnerability, our focus remains on minimizing risk and maximizing opportunities.
By focusing on clear rules and managing risk effectively, you can confidently navigate whatever the market throws your way.
👉 Want to stay ahead of market trends? Join our Weekly Strategy Sessions.
Looking for the best ASX stocks to buy now?
Motion Trader‘s algorithms scan more than 2,000 ASX stocks daily in search of medium term investment trends. We then tell our members precisely when to buy shares. And most importantly, we tell them when to sell.
Try a no obligation FREE 14-day trial of Motion Trader, and see what an algorithmic trading approach could do for you.
Video Links
For reference to the topics discussed:
09:30 SP500 sets up a reliable pattern that often does THIS
11:20 Make sure you’re aware of this major development
14:15 Be ready for this surprising scenario (many people aren’t)
15:35 This is what I’m currently doing with my portfolio

Jason McIntosh | Founder, Motion Trader
Jason’s professional trading career began over 3 decades ago. He’s a founder of two stock advisory firms, a listed funds management business, and has helped thousands of investors navigate the stock market. Click here to read Jason’s incredible story of, at age 20, sitting alongside some of the world’s greatest traders (and the life changing experience that came with that).

