Is the S&P 500 Signaling Trouble? Insights from Equal-Weighted Index | Episode 273

By Jason McIntosh | 20 December 2024
Is the S&P 500 Signaling Trouble?
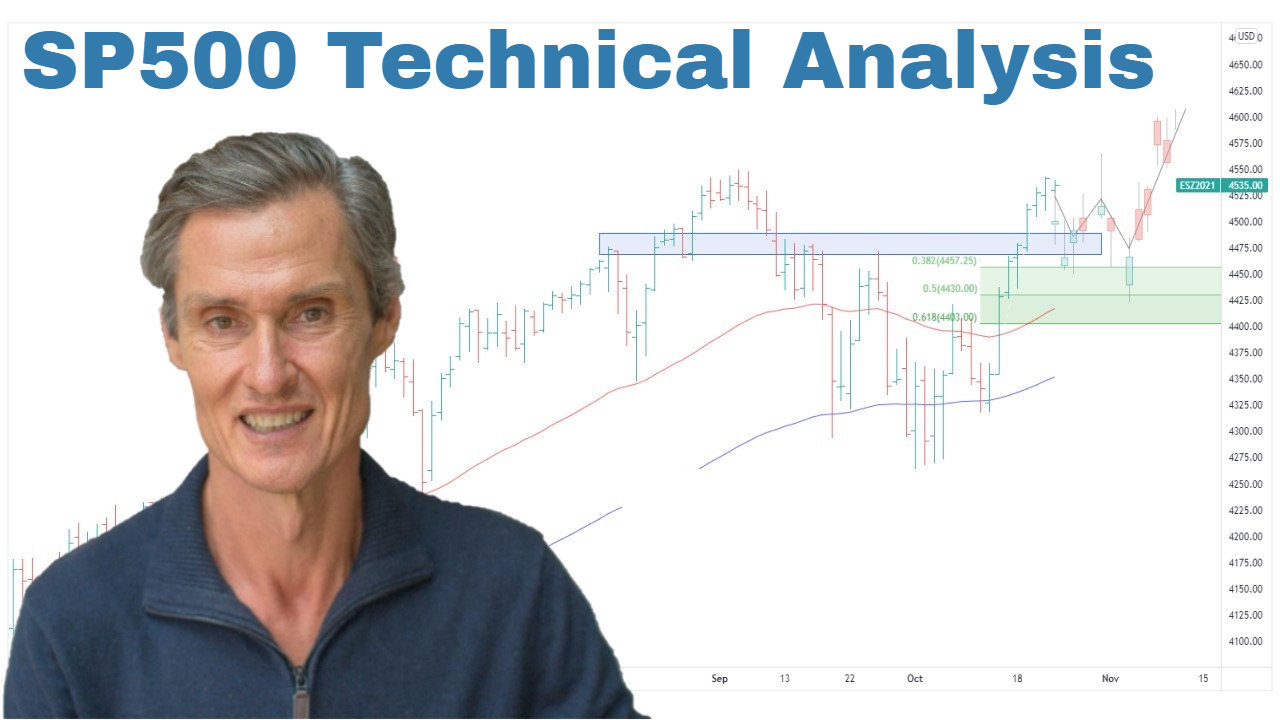
The S&P 500 has been one of 2024’s standout performers, but recent price action suggests investors should approach with caution. After a sharp pullback to its 50-day moving average, we’re seeing signs that this could be more than just a routine dip.
But is this a warning of broader market weakness, or simply a pause in the trend?
Let’s dive into the details.
The Big Picture: Why the Trend Still Holds
At first glance, the S&P 500 remains structurally bullish. Prices are holding near the 50-day moving average, while both the 50- and 100-day averages are rising. These are hallmarks of an ongoing uptrend.
However, focusing solely on the market-cap-weighted S&P 500 can give a misleading impression. That’s why I always look at the broader market, including the equal-weighted S&P 500, which paints a more nuanced picture.
Equal-Weighted S&P 500: Weakness Beneath the Surface
While the headline S&P 500 has shown resilience, the equal-weighted version tells a different story. Prices have slipped below their pre-election levels, signaling potential weakness among smaller constituents. This divergence between the headline index and its equal-weighted counterpart suggests that momentum could be faltering beneath the surface.
This type of internal deterioration often acts as a short-term weight on the broader market. Investors who bought near the recent highs may now be underwater and could look to sell into any rally, creating further resistance.
A Key Indicator: What the RSI Is Telling Us
One of the most interesting signals comes from the Relative Strength Index (RSI). On the equal-weighted S&P 500, the RSI has dropped into oversold territory, below 30. While some traders might see this as a buy signal, history suggests otherwise.
When RSI levels have reached similar lows in the past, the market has rarely rebounded immediately. Instead, it has typically spent time base-building before moving higher. The 2020 COVID sell-off, for example, saw RSI enter oversold territory long before the market bottomed. Similarly, pullbacks in 2022 and 2023 required time to stabilize before a meaningful recovery could take place.
This pattern indicates that investors shouldn’t expect a V-shaped recovery. Instead, we may see a period of consolidation as the market digests recent price action.
What Does This Mean for Investors?
While the S&P 500 remains in an overall bullish structure, the recent pullback and broader market weakness highlight the need for caution. Here’s how to navigate the current environment:
- Focus on Strength: Only consider high-quality setups with strong technical structures.
- Manage Risk with Trailing Stops: Use stops to protect capital and exit positions if trends deteriorate further.
- Be Patient: Avoid rushing to buy the dip. Allow time for the market to stabilize before taking new positions.
- Hold Extra Cash: Maintaining some liquidity can provide flexibility and peace of mind in uncertain conditions.
Conclusion: Proceed with Caution but Stay Focused
The S&P 500’s pullback to its 50-day moving average is not unusual for a bullish market. However, broader signs of weakness in the equal-weighted index and RSI suggest that this could be the start of a consolidation phase.
By managing risk carefully and focusing on stronger setups, investors can navigate this environment with confidence, ready to capitalize on opportunities as they arise.
👉 Want to stay ahead of market trends? Join our Weekly Strategy Sessions.
Looking for the best ASX stocks to buy now?
Motion Trader‘s algorithms scan more than 2,000 ASX stocks daily in search of medium term investment trends. We then tell our members precisely when to buy shares. And most importantly, we tell them when to sell.
Try a no obligation FREE 14-day trial of Motion Trader, and see what an algorithmic trading approach could do for you.
Video Links
For reference to the topics discussed:
13:00 SP500 pulls back (but THIS is more worrying).
17:00 Many people will interpret this indicator incorrectly.

Jason McIntosh | Founder, Motion Trader
Jason’s professional trading career began over 3 decades ago. He’s a founder of two stock advisory firms, a listed funds management business, and has helped thousands of investors navigate the stock market. Click here to read Jason’s incredible story of, at age 20, sitting alongside some of the world’s greatest traders (and the life changing experience that came with that).

