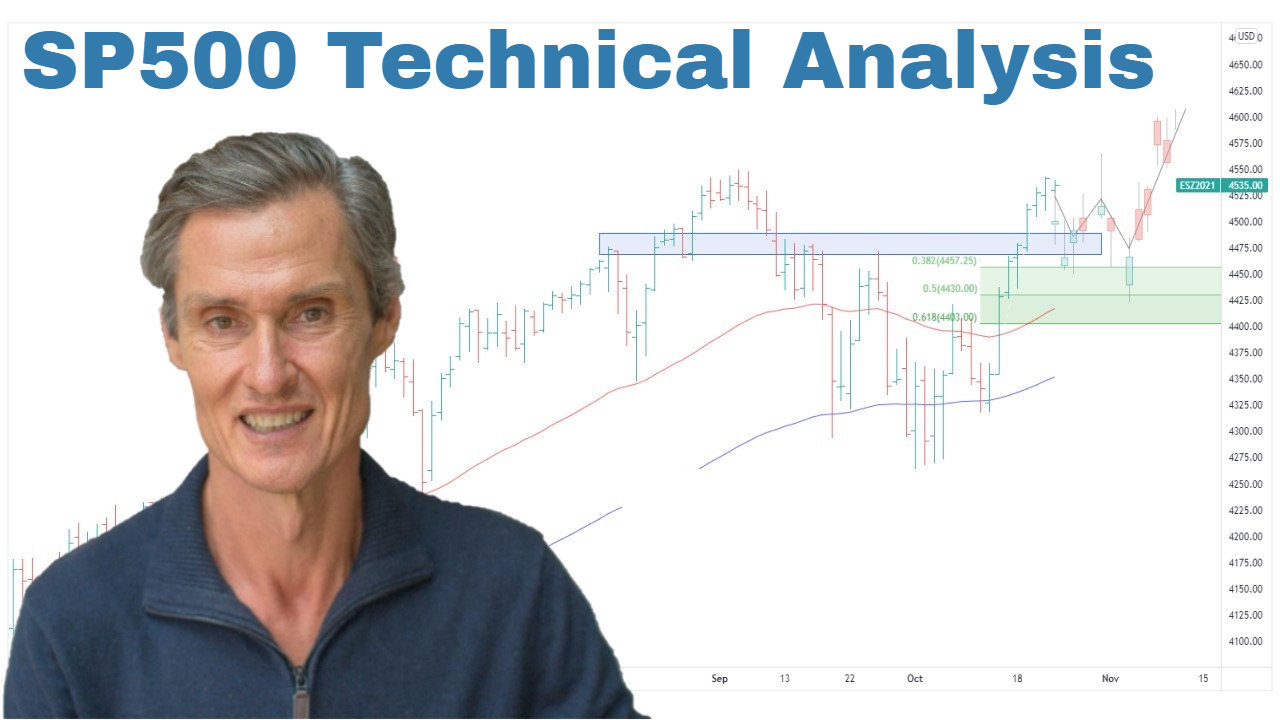
Is the S&P 500 Losing Momentum? Key Technical Insights | Episode 271

By Jason McIntosh | 13 December 2024
Is the S&P 500 Losing Momentum?
The S&P 500 has been a standout performer in 2024, but recent signs suggest we could be approaching a period of consolidation. While the trend remains firmly bullish, certain indicators are hinting at a potential short-term pause in the market’s upward trajectory.
Let’s break it down.
The Big Picture: Bullish Trend Intact
At first glance, the S&P 500’s chart paints a clear picture of strength. Prices remain above the rising 50-day and 100-day moving averages, which are hallmark indicators of a strong trend. This upward structure is the most important feature of the S&P 500 right now, and it’s a reassuring sign for investors.
But digging deeper into the data reveals another story.
Equal-Weighted S&P 500: A Broader View
The market-cap-weighted S&P 500 index is heavily influenced by a handful of tech giants like Nvidia, Apple, and Microsoft. However, when we look at the equal-weighted S&P 500, where each stock has an equal influence, we see a different picture.
On this basis, the last two weeks have shown a notable pullback. This pullback isn’t necessarily a red flag—it’s a normal and healthy feature of a bullish market cycle. But it does signal that broader market momentum may be slowing, even as the headline index holds near its highs.
A Key Indicator to Watch
One of the most revealing indicators right now is the percentage of S&P 500 stocks above their 100-day moving average. Over the past month, around 70% of stocks in the index were holding above this critical level—a sign of broad participation in the rally.
However, this figure has recently dropped to 58%, marking the lowest level since September. At that time, the S&P 500 experienced a 4.5% pullback. A declining percentage of stocks above their 100-day moving averages can act as a short-term weight on the market, particularly if the trend continues lower.
What Does This Mean for Investors?
For now, the primary trend in the S&P 500 remains upward. But the combination of a broader market pullback and fewer stocks holding above their 100-day moving averages suggests that some short-term consolidation could be on the horizon.
Consolidations like these are a natural and healthy part of any bull market. They allow the market to “digest” gains and build a base for the next move higher. As an investor, it’s important to:
- Stay Disciplined: Avoid making impulsive decisions during minor pullbacks.
- Monitor Key Indicators: Keep an eye on the percentage of stocks above their 100-day moving averages for further signs of weakness or stabilization.
- Use a Rules-Based Approach: A systematic strategy can help you navigate periods of market consolidation with confidence.
Conclusion: A Short Pause Before the Next Move?
While the S&P 500 remains in a bullish structure, the recent pullback in the equal-weighted index and the decline in the percentage of stocks above their 100-day moving averages suggest a short-term consolidation may be approaching. For investors, this is a time to remain focused on the bigger picture and prepare for opportunities that could emerge when the trend resumes.
By following a systematic, rules-based strategy, you can confidently navigate these market pauses while positioning yourself for the next leg of the bull market.
👉 Want to stay ahead of market trends? Join our Weekly Strategy Sessions.
Looking for the best ASX stocks to buy now?
Motion Trader‘s algorithms scan more than 2,000 ASX stocks daily in search of medium term investment trends. We then tell our members precisely when to buy shares. And most importantly, we tell them when to sell.
Try a no obligation FREE 14-day trial of Motion Trader, and see what an algorithmic trading approach could do for you.
Video Links
For reference to the topics discussed:
07:10 Be ready for this scenario—I’ve seen it many times.
11:50 The overlooked S&P 500 indicator (Don’t miss this).
15:00 Why most investors miss key S&P signals.

Jason McIntosh | Founder, Motion Trader
Jason’s professional trading career began over 3 decades ago. He’s a founder of two stock advisory firms, a listed funds management business, and has helped thousands of investors navigate the stock market. Click here to read Jason’s incredible story of, at age 20, sitting alongside some of the world’s greatest traders (and the life changing experience that came with that).

