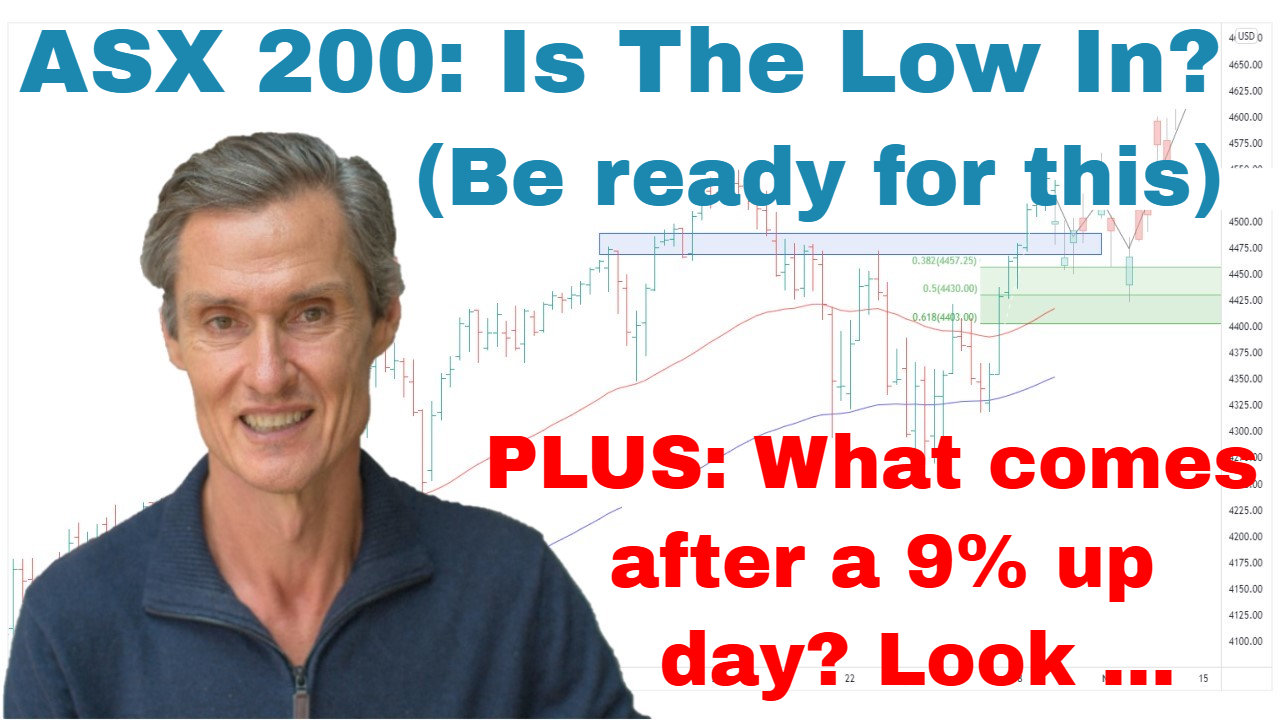
ASX 200’s Extreme Swings — Is Peak Volatility Behind Us? | Episode 289

By Jason McIntosh | 11 April 2025
ASX 200: Volatility Hits New Extremes
After a two-week reprieve, volatility stormed back into the Australian market. Monday’s sharp sell-off has now made this the most volatile period for the ASX 200 since the COVID crash in 2020.
Key Developments:
- Failed structure: We’ve seen a steady deterioration over the past few weeks—from a failed breakout to falling below the 50-, 100-, and 200-day moving averages.
- Shallow bounce: The weak rebound from mid-March was another warning sign. We highlighted this structure in previous weeks as increasingly vulnerable.
- Current low: The recent panic-driven drop has taken the ASX 200 well below its 50-day moving average.
Oversold Indicator:
Using our trusted percentage below 50-day moving average indicator:
- The ASX recently fell over 8% below its 50-day moving average.
- Historically, this level has signaled oversold conditions and potential rebounds.
- Past examples (like 2018 and 2022) show that even after rebounds, retests of the low are common.
Key Insight:
This could be a panic-based decline that passes over coming months—or the start of something longer-lasting. We don’t yet know. What we do know is:
- Charts don’t predict the future, but they help us prepare for various outcomes.
- Current structure is weak, so risk management is essential.
Learn more about how we use moving averages to manage risk: Expert Trading Techniques
What This Means for Investors:
- Individual stocks: Too risky below key moving averages. This is not the time to bottom-pick.
- ETF entries: If buying, consider modest averaging into index ETFs (not individual stocks) with a longer-term view.
- Trailing stops: These remain critical for protecting capital.
S&P 500: Historic Moves Raise Caution Flags
The U.S. market saw its fifth-largest 2-day sell-off since 1950 last week—topped off with the eighth-largest one-day rally in 100 years. It’s a level of volatility rarely seen.
Is the Worst Behind Us?
Let’s look at history:
- COVID crash (March 2020): Big rally marked the bottom.
- GFC (Oct 2008): Big rallies led to temporary relief, not a bottom.
- 1987 crash: A similar massive bounce came with messy price action for months.
Technical Structure:
- Still below the 200-day moving average.
- Equal-weight S&P 500 is showing lower highs and lower lows.
- Only ~17% of stocks are above their 100-day moving average (was under 10% days earlier).
Historically, reversals below 10% participation often occur near market lows—but not instantly. It typically takes weeks of stabilisation for a bottom to form.
What Needs to Happen:
We’d want to see this stock participation number rise to 25%+ before considering the low might be in. Until then, this remains a fragile market.
A Worrying Sign: U.S. Bond Yields
Let’s talk about something that’s flown under the radar—the U.S. 10-year bond yield.
- Locked in a range below 5% for over a year.
- Recently saw a sharp move higher, though still under resistance.
- A breakout above 5% could signal higher-for-longer rates and renewed market pressure.
If yields break above 5%, the risk of prolonged market turbulence increases.
Final Thoughts: Proceed With Caution
- This is not a time for bold moves.
- Oversold conditions are present, but not all oversold markets bounce immediately.
- Avoid panic buying or selling. Let the structure evolve.
- If we see improvement in indicators like breadth (more stocks above key averages) and lower volatility, it might be time to act.
Until then, keep your risk low, stick to your plan, and be patient.
👉 For a deeper dive into technical analysis, check out our Weekly Strategy Sessions.
Motion Trader‘s algorithms scan more than 2,000 ASX stocks daily in search of medium term investment trends. We then tell our members precisely when to buy shares. And most importantly, we tell them when to sell.
Try a no obligation FREE 14-day trial of Motion Trader, and see what an algorithmic trading approach could do for you.
Take a Free 2 week Motion Trader trial
Video Timestamps
00:00 Intro
00:40 ASX 200: Why this blindside event could have been worse
04:40 Was that “peak volatility”? (Look what this indicator says)
09:20 If you want to start buying, ONLY consider this
12:20 I’m doing this now (but avoiding THIS)
13:45 SP500 sets bearish AND bullish records in one week
14:35 What happens in the weeks after a 9% up day?
18:10 This indicator is extreme (what often happens next)
20:55 One thing that has me worried (be aware)

Jason McIntosh | Founder, Motion Trader
Jason’s professional trading career began over 3 decades ago. He’s a founder of two stock advisory firms, a listed funds management business, and has helped thousands of investors navigate the stock market. Click here to read Jason’s incredible story of, at age 20, sitting alongside some of the world’s greatest traders (and the life changing experience that came with that).

