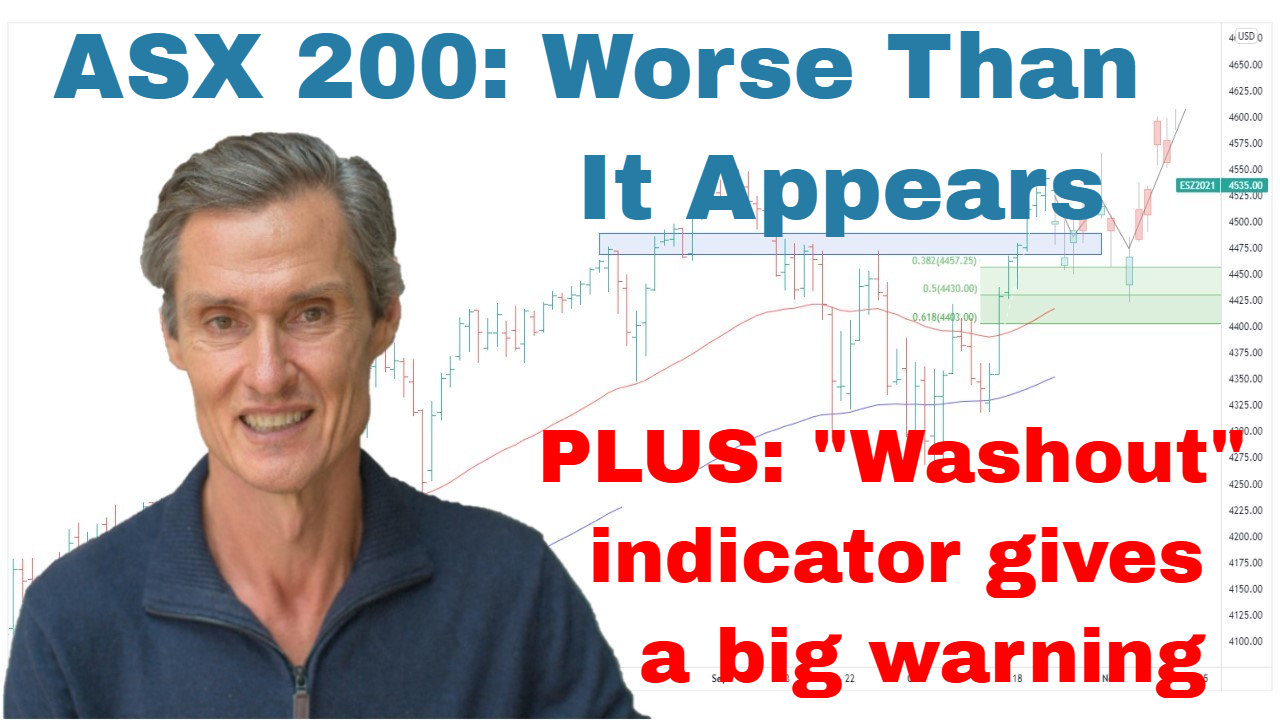
ASX 200 Volatility Returns—How Bad Could It Get? | Episode 288

By Jason McIntosh | 4 April 2025
📊 ASX 200: Sharp Reversal Signals Caution
After a brief two-week reprieve, volatility is back — and in a big way.
- The ASX 200 hit an eight-month low on Friday, following a dramatic gap down on Thursday.
- A shallow bounce off the March low saw the index consolidating below declining 50-day and 100-day moving averages — a notable structural shift.
- This transition from rising to falling moving averages is critical. Buying the dip works well when prices are above rising averages, but when the structure flips, selling into rallies becomes more common.
Key Support in Focus
- The ASX 200 is testing major support around 7,600, a level defined by prior highs (2021–22) and trading activity through 2024.
- While Friday’s session looked relatively stable, equal-weight data reveals broader weakness beneath the surface.
- The ASX 200 Equal Weight Index broke support at 1,800 and now trades at a 14-month low.
Technical Indicator Watch
- The index recently stretched about 6% below the 50-day moving average — a level that historically signals potential for a rebound.
- A similar structure in 2018 featured:
- Initial sharp selloff
- Weak bounce
- Retest (and break) of the low
- Several months of consolidation
- A 15% drawdown from recent highs (noted as possible in the current setup) would bring the index near the bottom of the current shaded zone.
Strategy
- Stay defensive and protect capital.
- Use wide trailing stops to stay in strong positions and exit weakening ones.
- Avoid letting losing trades run — sharp declines can punish poor risk management.
Learn how to use trailing stops effectively →
🌐 S&P 500: Worst Daily Drop in Nearly Five Years
The U.S. market took a heavy hit:
- Thursday marked the biggest single-day fall in the S&P 500 since June 2020.
- The index is down 8.3% year-to-date (first 63 trading days) — the 8th worst start to a year in history.
200-Day Moving Average: A Warning Signal
- The S&P 500 remains below its 200-day moving average.
- Brief dips under this line can reverse quickly, but multi-week stays often lead to:
- Bear markets (e.g., 2022, GFC)
- Messy multi-month consolidations (e.g., 2015, 2018)
What to watch for when prices move below major averages →
Equal Weight Breakdown
- The equal-weighted S&P 500 now has:
- Three lower lows
- A series of lower highs
- Price action below declining moving averages
- A clear sign of weakening breadth.
Breadth Indicator: More Room to Fall?
- Only 29% of S&P 500 stocks are above their 200-day moving average.
- Historically, washouts near 10% often signal major market lows.
- At 29%, we may still be a way from true capitulation.
📊 What History Suggests
Despite the doom and gloom, historical data provides some perspective:
- Among the 20 worst starts to a year, 12 saw gains by year-end.
- Of the 7 that continued to fall, only 4 saw losses worse than 11%.
- The worst example (-35%) occurred during the GFC.
So while risks are real, a total unraveling isn’t inevitable.
⚡ Final Thoughts
There’s no need for panic, but plenty of reason for caution:
- The technical structure in both the ASX 200 and S&P 500 remains weak.
- Trailing stops, risk management, and patience are key.
- Don’t chase early rebounds — wait for confirmation through price strength and improving breadth.
Every tough period eventually gives way to a new wave of opportunity. The key is protecting capital and staying ready.
👉 For a deeper dive into technical analysis, check out our Weekly Strategy Sessions.
Motion Trader‘s algorithms scan more than 2,000 ASX stocks daily in search of medium term investment trends. We then tell our members precisely when to buy shares. And most importantly, we tell them when to sell.
Try a no obligation FREE 14-day trial of Motion Trader, and see what an algorithmic trading approach could do for you.
Take a Free 2 week Motion Trader trial
Video Timestamps
00:00 Intro
00:32 ASX 200: Volatility is back (how much worst could it get?)
02:50 This is when to buy the dip – and this isn’t
05:00 Why Friday’s sell-off is worse than many people think
05:40 Could this scenario play out again (it will surprise many)
09:50 The most important thing I can tell you now
11:00 SP500 hasn’t done this since Covid (but THIS is more significant)
15:50 Look what this “washout” indicator points to now
18:55 You’ve got to see these stats (the outcomes will surprise you)

Jason McIntosh | Founder, Motion Trader
Jason’s professional trading career began over 3 decades ago. He’s a founder of two stock advisory firms, a listed funds management business, and has helped thousands of investors navigate the stock market. Click here to read Jason’s incredible story of, at age 20, sitting alongside some of the world’s greatest traders (and the life changing experience that came with that).

